
Every month, about 1,200 people in the US search Google for “Google Analytics help.” It's not a reflection of anything they missed. Google Analytics (GA) is complicated, even for experienced marketers.
So let's make it less complicated. With the right GA metrics, like the number of users or average session duration, you can determine what is and isn’t working on your website. As a bonus, you can always go deeper and fine tune the reports to show you critical opportunities to improve your website.
Now with the July 2023 full switch to Google Analytics 4 for all new data, website analysts have more questions about which metrics to learn and where to find them.
Shortly after GA4 was released, Google stopped sending any new data into the previous version, Universal Analytics. If you had a UA property in Google Analytics, you can still access historical data from June 30, 2023 and earlier. (Some properties got data passed in for a bit longer.) You can find more instructions at the end of this article on how to work with those metrics.
All the data you need to make your business successful is in GA. You just need to know where to look. With this guide, we’ll show you the eight most important metrics to track, where to find them, and how to use them to improve your website. This isn’t everything GA offers, but it’s a starting point for you to collect the information you need to make genuinely data-backed decisions about your business.
1. Users
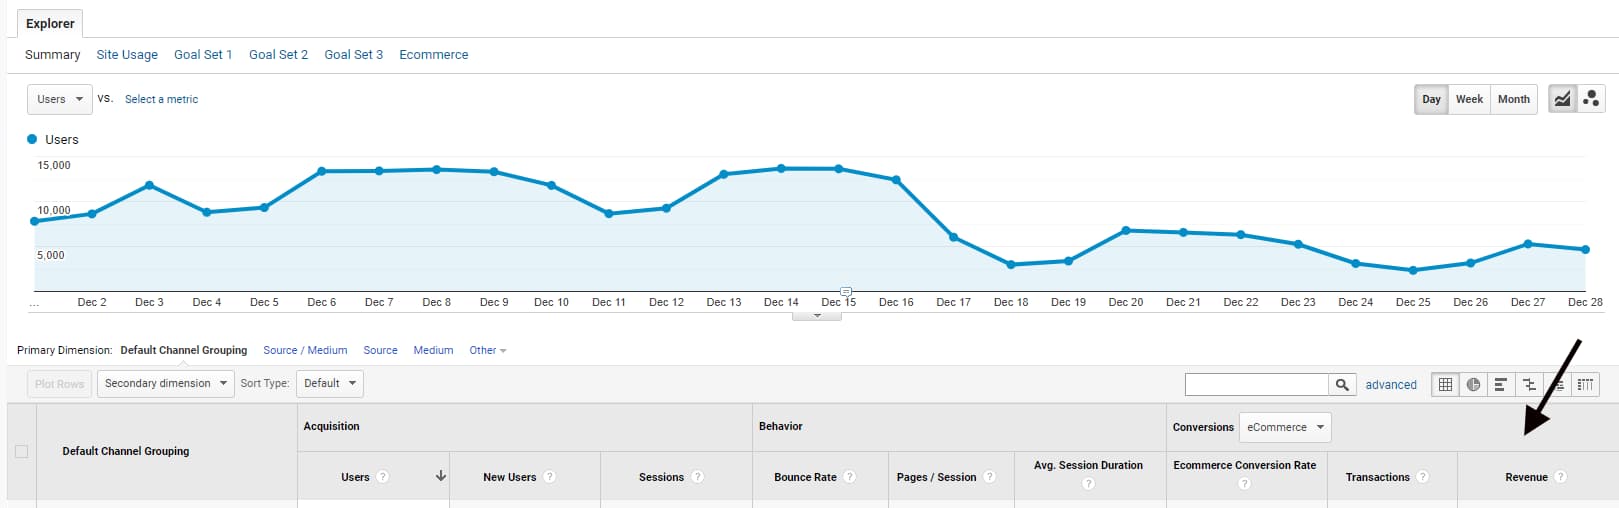
Basic user metrics tell you how popular your site is by showing how many people visit your site in a given time frame. However, the user-focused charts on your Google Analytics dashboard offer far more insightful details.
The basic user count (new users and return users) appears by default on your Google Analytics home page. You can adjust the time setting on the chart so that you can track the changes in users across a week or across months.
You should measure:
View a Reports Snapshot of your Users. This will give you a peek at multiple ways to view your users: their locations, what channels bring them in, how many visit on different days of the week…let this spark ideas for paths you want to follow.
How to get there: Reports>Reports Snapshot
What we're looking for are stories about your Users and how you can use that to double down on certain marketing efforts and tweak others for improvement.
Measure users over a month so you can see if there are microtrends within a month--like a flurry of visitors close to traditional pay periods. Watch for recurring patterns that tell you if a certain weekday drops off. You can build a promotion around that date or amp up your ads around that day.
Note: If you had been measuring users before, you might see a jump in your usual numbers with GA4. The new version can measure any users that launched your app, and it will count them in the total active Users count. UA did not do this, so even if your Users stayed the same, your numbers could look different--especially if you have high app usage.
Why it’s important: Tracking your users month over month gives you a broad overview of whether your optimization efforts are paying off. An increase in users is a sign that things are working, while the opposite holds true as well.
Remember, user metrics are broad indicators, and your strategies aren’t the only thing influencing them. Any big drops could signal usability issues on your site. Gains or losses are influenced by other events like the time of year, Google algorithm changes, or current events. Use this metric as a quick overview, and then explore more to find out why you’re getting an increase or decrease.
What you can do with this data: Find out which traffic sources are up or down over the last quarter. If one source is up, find out why so you can double down and replicate the success going forward. If a traffic source is down, diagnose the problem and do what you can to fix it.
For example, if your organic traffic (visitors from search engines) is up, it could show your SEO efforts are paying off. Explore what pages and keywords are working so you can optimize them further.
But if your referrals from social media sites are down, it could show that changes to your social media strategy aren’t working. You should then try to change things up by putting your efforts into new content or changing up the social media sites you’re focusing on.
2. Landing Page Sessions
The number of landing page sessions is a record of how many times a user viewed a particular page as their first page on your website. We usually read "landing page" and think of paid ads, but in this case, you are measuring an entry point for any channel.
Why it’s important: Tracking landing page sessions tell you how users find their way onto your site. However, you can also filter the report so that you know how people enter (organic search, for example), but you want to see where they come in and how they engage. It tells you what topics and what level of the funnel these people are interested in, so you can create more content like that.
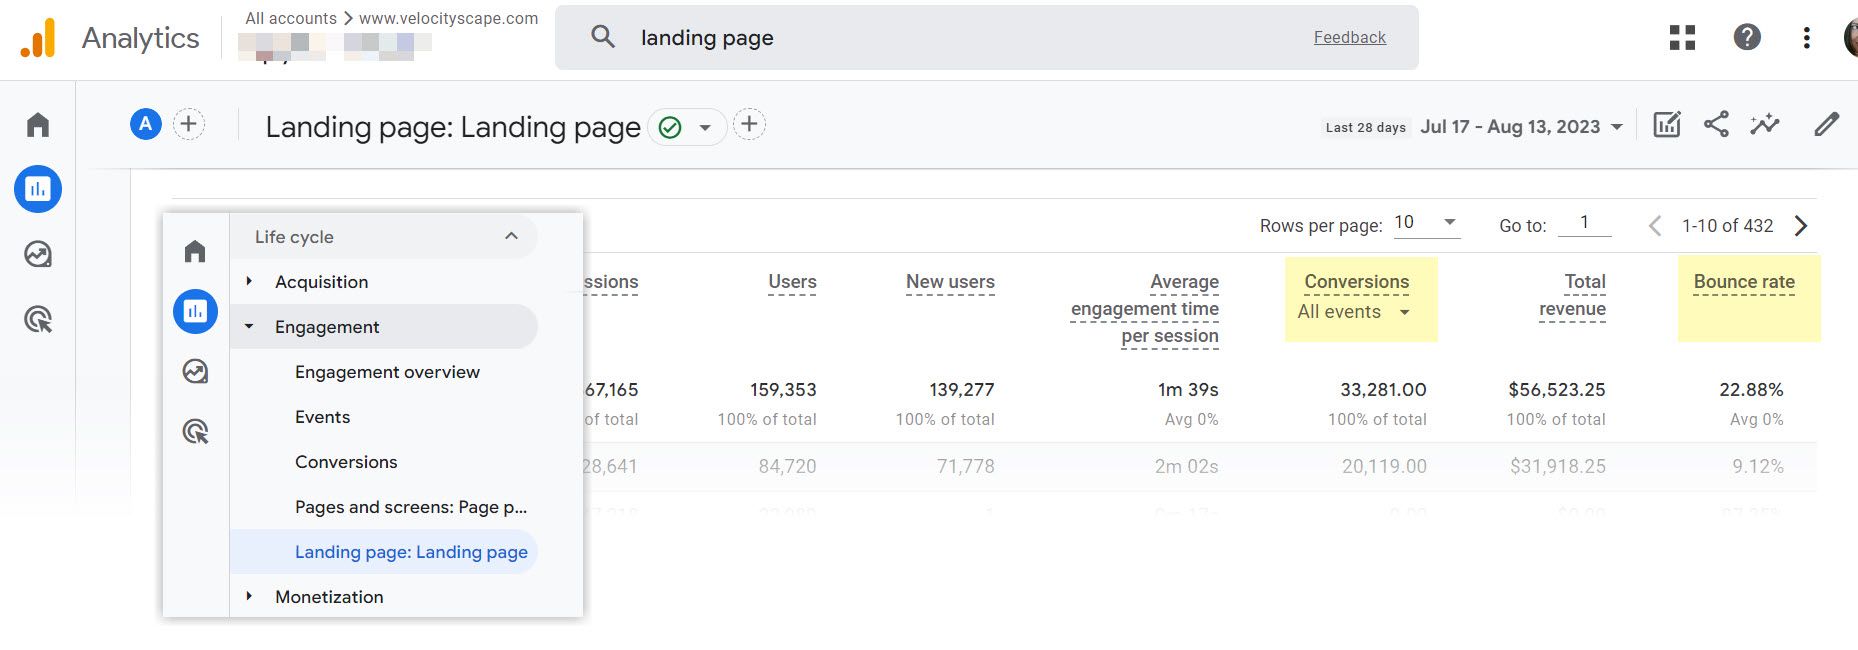
How to find landing page sessions: Reports>Engagement>Landing Page
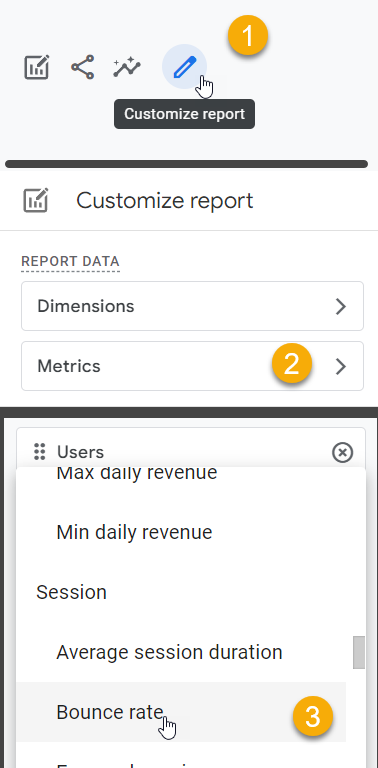
How to go deeper: Monitor and track your landing page bounce rates and conversions through your landing page report. You will probably have to add bounce rates as a custom metric, but that's easy to do through the customization icon in the upper right corner of the report.
What you can do with this data: This report should help you learn which pages to funnel your traffic to. The pages that convert well should get more traffic (via ads, links from internal pages, etc.) while you optimize the lower-converting pages.
Further, a high bounce rate could show you a landing page that desperately needs attention. GA4 makes bounce rate much easier to understand: users left within 10 seconds. The best solution for that is to check how well your landing pages match search intent.
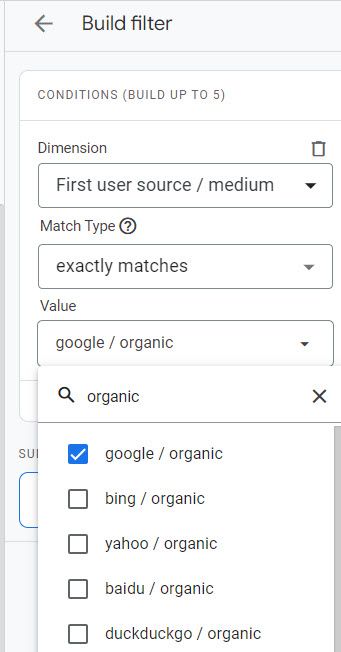
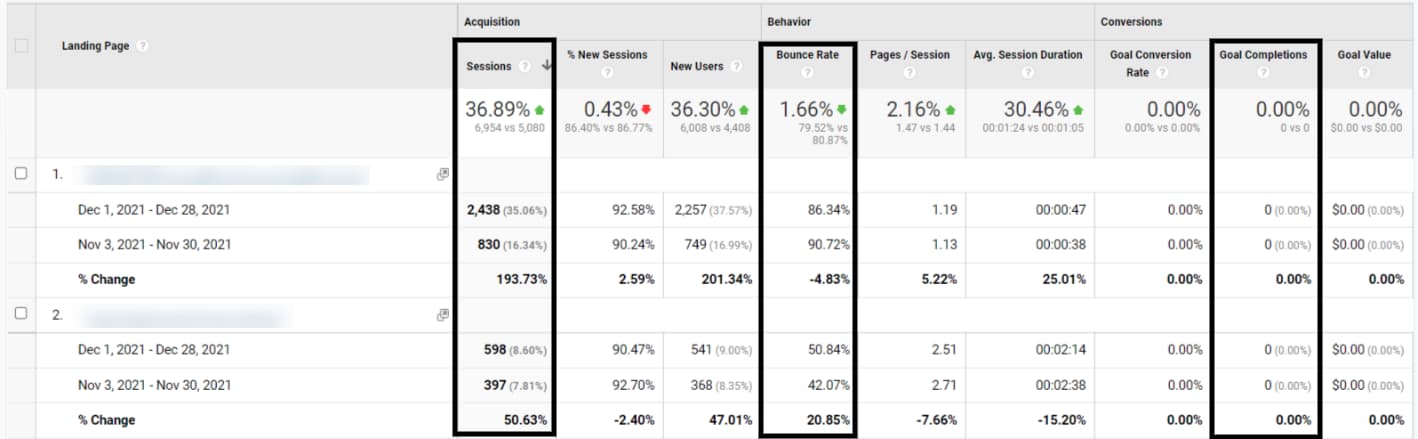
Remember, your Landing Page report isn't just for pages that you point your ads to. It captures the pages that are the entry points for your customers. That means that you can filter the report to show individual pages and measure the way visitors got there.
We used this source/medium filter to get engagement metrics for visitors that came in via organic search. It's similar to what we can find with Google Search Console, but here we get deeper metrics for each page.
3. Entrances and Exits
Exit rate is the percent of a page's sessions that end there. Exiting at your first page is bad. Exiting at a receipt page or a "congratulations" page is better.
To track these, you will want to know the entrances and exits for your pages. Entrances are similar to landing pages, but they measure "first time" interactions differently.
Landing pages are the first page a visitor ends up on when they get to your website. Entrances start with the page and then count how many sessions started there. That means that entrance rate is the percentage of sessions that started on a specific page. There's no landing page rate, because it's a dimension, listing the page path and query string in the report.
Exit is not the same as Bounce Rate. Exits show that the user did not move onto any other page on your site, no matter what they did on their last page with you. Bounces show that the user was not engaged with a page.
What you can do with this data: The goal here is to find patterns in your data so you can better understand the people who arrive at your site. The more you know about the people who do and don’t convert, the more you can optimize the experience to improve on those numbers.
How to find exit rates:
There is not an automatic report built for entrances and exits, but you can use the Explore feature just below Reports in the navigation bar.
You're going to build your own report by dropping your data into a visual chart that's built to your specifications.
I'll keep it basic. You can customize this as much as you'd like.
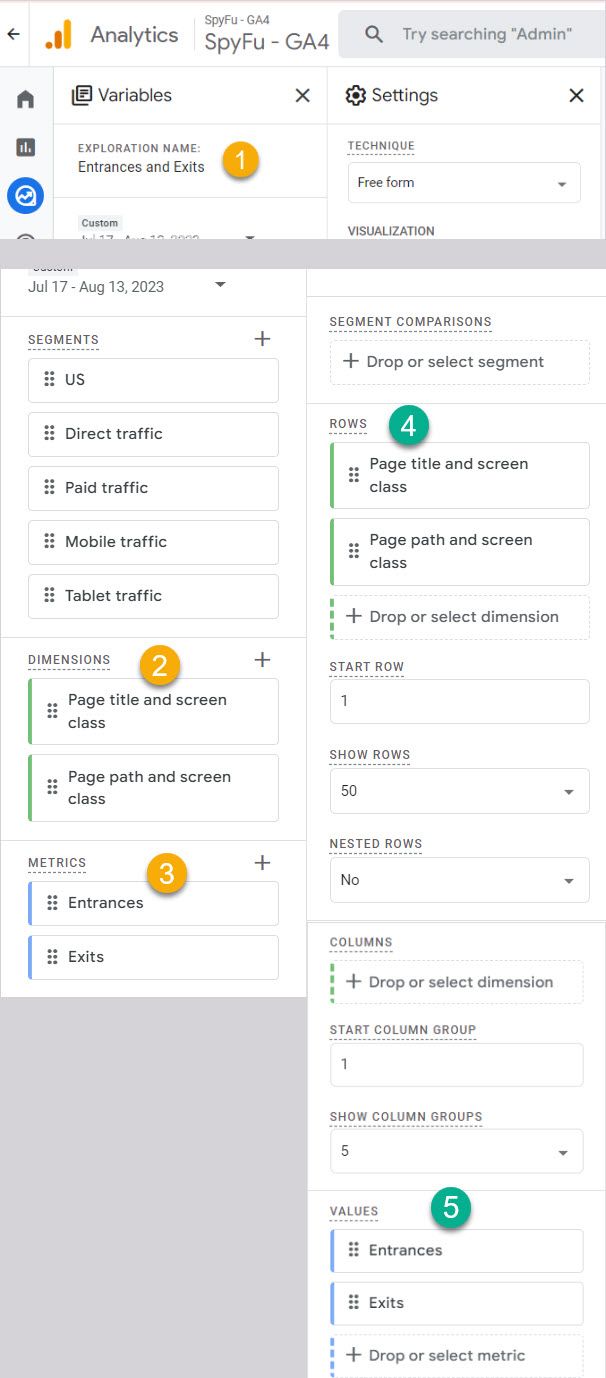
Explore>Free Form option. From here, you will be selecting the elements you want to measure. Here are the steps I took:
- First, update the Exploration Name in the upper left. I picked "Entrances and Exits."
- Select dimensions that you want to track: I went with page titles and page paths.
- Choose the metrics you will see for those dimensions in step 2. Here's where you select Entrances and Exits (separate metrics) and Sessions. Import all.
- Assign those dimensions to your rows
- Finally, choose the 3 metrics in your column values.
Google will keep this for you in a library, but you can delete any explorations you don't use.
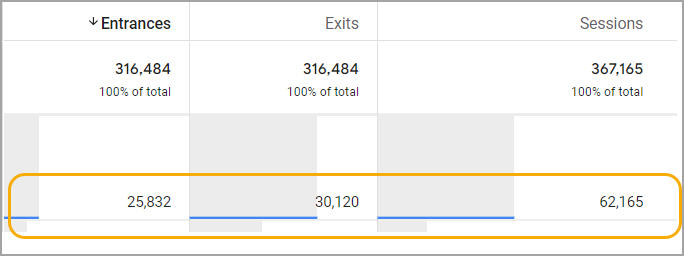
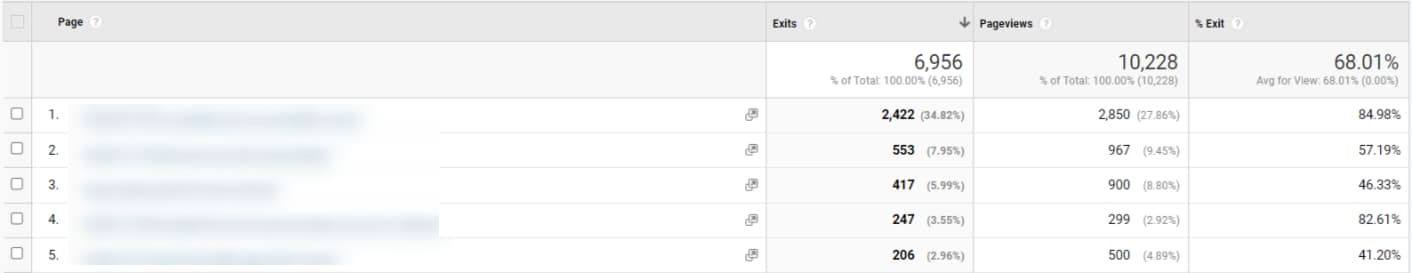
How to go deeper: Use the dimension “Sessions” to give these context. Without it, I saw a page with more exits than entrances--it didn't really make sense. Then I remembered that a user can exit a page without starting there (an entrance) and vice versa.
With a count of sessions, I was able to see the pages with a different lens. A little over 40% of sessions were starting on this page, but about half of them ended there. It helps to change your perspective and remind you how the users are moving through your pages.
What you can do with this data: The goal here is to find patterns in your data so you can better understand how people decide to move on or stop in their visit to your site. The more you know about the people who do and don’t convert, the more you can optimize the experience to improve on those numbers.
4. Engagement and Bounce Rate
This is one of my favorite changes with Google Analytics 4. It's easier than ever to explain Bounce rate in GA4, especially since it works as a complement of Engagement rate.
When a user starts a session on your website, they can interact with your site by viewing more than one page, triggering a conversion, or staying on a page for at least 10 seconds. If they do any of these, that's an engaged user. If they don't, that's a bounced user.
Why it’s important: It’s a shorthand measure for how engaging your content is. If people get off your site quickly after visiting a product page, then there's a disconnect between what you are promising them and what they find--or at least how they perceive what they find. Plus the more time people engage with your site, the more they are open to your messaging and more likely to take action.
How to find engagement on your pages: Reports>Engagement>Pages and Screens
How to go deeper: Find your engagement and bounce rates of traffic that comes in via a particular channel. The previous method helps you understand how users view the content on your pages compared to their expectations.
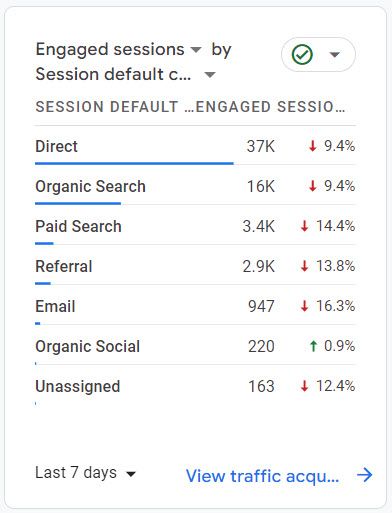
By measuring engagement by channel, you shift the focus away from specific pages and onto specific messages. That way you know if there is a disconnect between how you draw in visitors and what they see when they get there. Go to Reports>Acquisition>Traffic Acquisition>Traffic acquisition: Session default channel group. Look for engagement metrics in the chart.
What you can do with this data: Find your most engaging content and emulate it. For example, if people stay longer on an article involving proprietary data, create more content like that since people are obviously consuming it more than other blog content.
Find content that isn’t doing its job properly. You can expect a low engagement time with some content — for instance, your FAQ page. People who go to FAQ pages usually have a single question they want an answer to. If your average sessions last more than five minutes on your page, that might show it’s hard to navigate or understand. If you’ve got an FAQ page with a high time on page, rewrite it to improve your users’ overall experience.
Note: don't forget to ask for insights by clicking this icon or typing into the search bar at the top of your analytics. This can point you to a quick answer (like "Top page title by bounce rate) or give you ideas of some takeaways you hadn't considered.

5. Events: Actions That Build to a Conversion
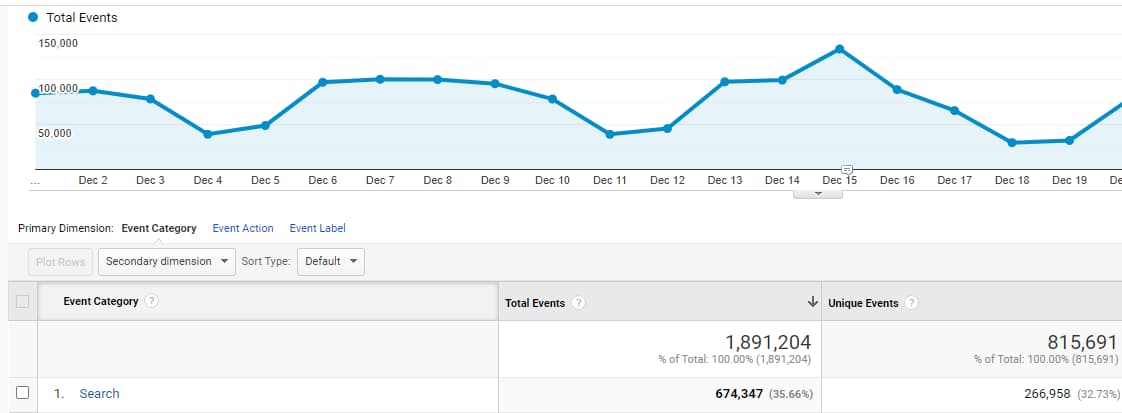
Events are markers you set up to help you track any actions that happen on your site. For instance, you could create an event around using your search bar or pressing play on an explainer video. Events also can track sign-ups and purchases as conversion events.
Each time someone performs this action, the event counter will go up by one. That's the basic part of it. But loaded into GA4, your top events let you track performance and identify your strongest marketing efforts.
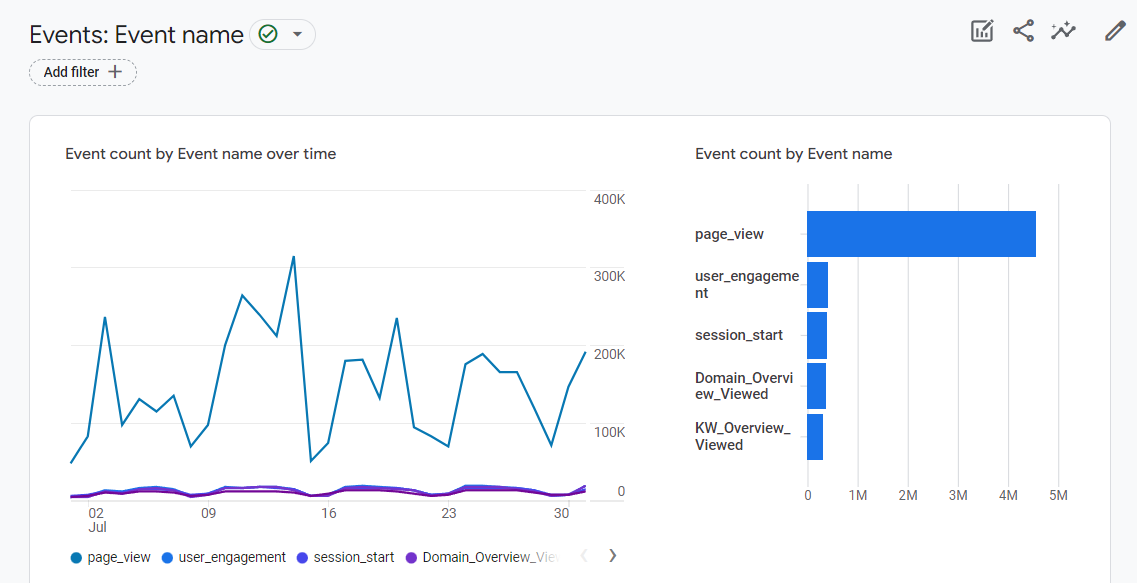
Why it’s important: More than ever Google Analytics 4 encourages users to rely on events to track user behavior that leads to your page's success. It's no longer one big "purchase" action but instead a series of micro It tells you what people are doing on your site.
If you know that a high percentage of people are clicking on the videos on your features page, then you could decide to invest more into creating video content. You should also use events to track important actions on your landing pages. For instance, you could set trackers on clicks that take users to a “Learn More” page or a “Buy Now” page. If more people click on “Learn More,” you could decide to include additional information on your landing page so that users feel confident in clicking "buy now."
How to find top events: Reports>Engagement > Events
How to go deeper: Event parameters help you learn more details about behavior leading up to the event (or about the users completing the event).
What you can do with this data: Use this data to make your users’ journey smoother. If people are often going from A to B to C, could you make their journey smoother by making it possible to go from A directly to C?
Remember that good user experience (UX) is a major part of optimizing your site. Events that don't get triggered as much as others might be a clue to usability issues that you would have overlooked.
On a more advanced level, our in-house CRO (Conversion Rate Optimization Manager) is looking for GA4 to help him track performance of an A/B test. Custom events--where we create two separate events from that test--seems to be the ideal track to accomplish this.
And one more: Understand what critical steps users took to get to conversion. If you know that people who watched your explainer video are more likely to convert, you could try promoting that video or the key pieces of information around your website and social media.
6. Click-Through Rate
Your click-through rate helps you gauge the ratio of people who see your PPC ads or organic results and click on them.
You can find click through rate (CTR) for organic search in some of your GA4 reports. It's a metric called clicks per impression.
CTR (organic) = clicks per impression
Look for a decimal (instead of a percentage) as this will be shown like 0.23 instead of 23% of impressions getting clicked. You must have an active Search Console link to your Google Analytics before you can see this metric in your reports.
So far, we do not see a way to pull CTR for paid ads through GA4. Google Analytics includes (number of) Google Ads Clicks in the Acquisition Overview report (Reports>Acquisition>Acquisition Overview).
But without a count of ad impressions, there's no way to calculate the click through rate. To get that, you will need to link your Ad Manager to your Google Analytics. Then it will start pulling in data like ad impressions so you can find your paid CTR.
Why it’s important: Click-through rate (CTR) is best for telling you how effective your ad copy or meta tags are. If your ad copy or meta-descriptions don’t sound useful, interesting, or appealing to the reader, they won’t click, and your CTR will decrease. If people aren’t clicking on your organic listing or ad, you don’t even have a chance to convert them. So optimizing your lowest-performing ads or organic listings is a quick way to bring in more traffic since you’re already ranking for them.
How to go deeper: If you want the organic CTR of a unique event on your page, you’ll need to set an event on that page and then divide that event by unique visitors to that page.
What you can do with this data: You see how effective your top landing pages are at getting users to click through to the next step of your signup or purchasing flow. Landing pages with low CTRs should be improved with tactics borrowed from higher CTR landing pages. If all of your CTRs are lower than you would like, then take your most important landing page and start performing A/B tests. A/B tests have you test two versions of the same landing page that differ in one key way, like a different headline or image. After a couple of months, check the CTRs on these two versions and adopt the more successful one.
7. Revenue by Traffic Source
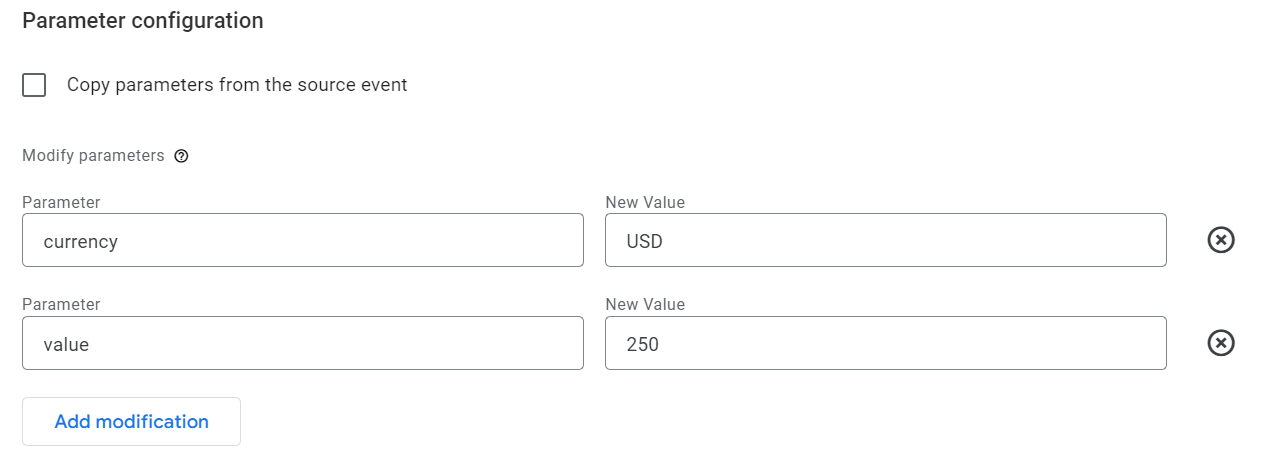
Revenue by traffic source looks at how much money each traffic source brings to your site. Our past advice for UA was to set up ecommerce on your site or put a dollar value to each of your goals. Now with GA4, your analytics measures all conversions as events. Unfortunately, adding a value to those events takes a little more maneuvering.
First, you will need to add a custom event parameter to your event. Then you need to create a custom metric for that parameter (in this example, the dollar amount). After that, you can add the custom metric to your reports.
Why it’s important: If you know what sources are bringing in the most revenue for you, you can focus more money on those areas. Conversely, you can reduce investment in your weaker revenue sources or change tactics to improve those sources.
How to find revenue by traffic source: Reports>Acquisition >User Acquisition
I like the First User Default Channel Group report for this information. I can see conversions and revenue by traffic source. Also, our CRO likes to look at user behavior per traffic source: how engaged are the people that came in from paid ads, compared to the traffic from videos? This allows us to dig into behavior for each traffic source.
How to go deeper: Compare how much you’re making from these traffic sources to how much you’re spending on them.
What you can do with this data: Find your most efficient revenue sources and put more money into them to get even more revenue. Make sure to include all costs when doing the calculations, even something like the cost of paying someone to create content for your organic traffic or socials.
If you have multiple goals, look at revenue by goal to see if certain goals are bringing in more revenue and what source(s) that revenue is coming from (direct traffic, organic search, referral, paid search).
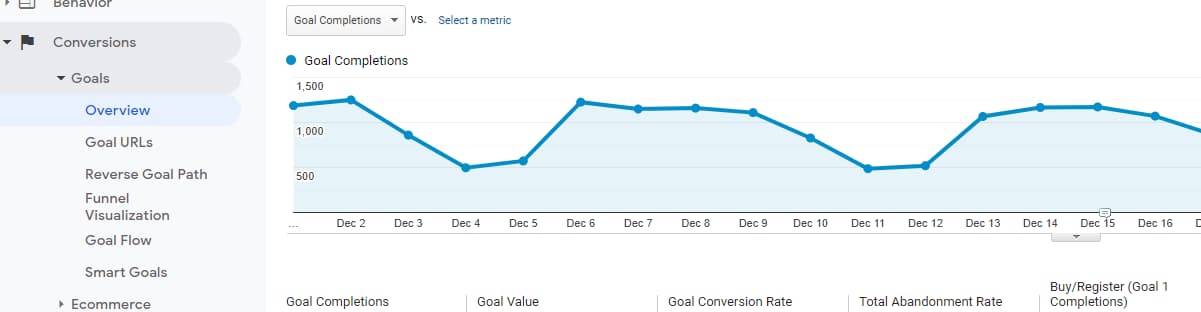
8. Your Final Goal: Conversions
With Google Analytics 4, your Conversion events track the actions that help your website achieve its target objectives. We mentioned this earlier in the Events section, but Conversions have their own part of the page to navigate to.
You will need to designate some events as conversions in GA4. Go through your Admin settings to the Property column where you can find Events and Conversions, separately.
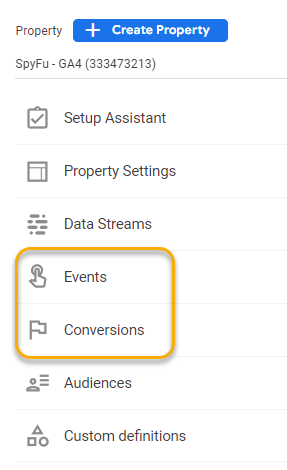
You can designate an existing event as a conversion as long as it has already been triggered. There's a "Conversion" toggle switch in your list of events.
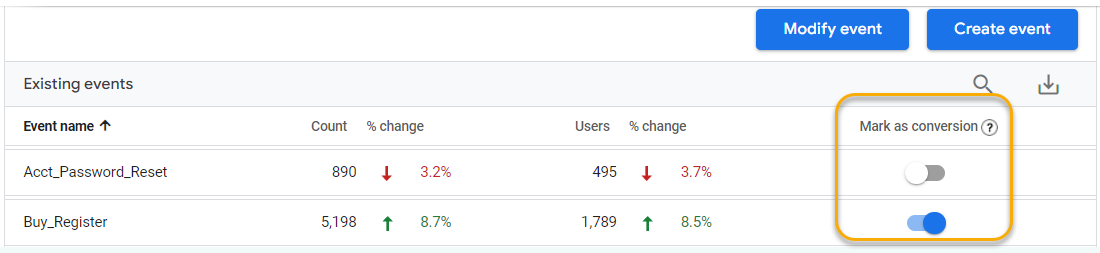
If you haven't triggered the event yet, it won't show up in that list. In that case, go to Conversions (just below Events in Admin) and mark it there.
Choose conversions that are action-steps that your user can take along the way toward a purchase or sign-up. You can choose micro conversions like "add to cart" or "loyalty program signup" that get you one step closer to a larger goal.
Why it’s important: It tells you how well your website is doing at achieving its goals at all points of the funnel. By doing up-front legwork to set conversions, you get a quick snapshot you can refer back to on how well your website is performing over time. Your goals do not have to be strictly money-based either. If you run a cooking website, you could consider engagement as your target and set an event for users spending x number of minutes per session and then setting that as a conversion.
How to find your Conversions report: Reports>Engagement>Conversions
How to go deeper: Look at your conversions and see how they change over time as you experiment with your pages to produce more conversions. Keep in mind that this angle measures frequency of specific kinds of conversions like "how often do people buy this product."
If you want the angle of how often certain channels convert, you will need to pull up the Traffic Acquisition report (Reports>Acquisition>Traffic Acquisition) to get those metrics. And of course we covered specific page conversions in the section on Landing Pages.
What you can do with this data: Zoom out by looking at a yearly trend line and see how your conversion rate has changed over time. This is especially important if you’ve made big changes to your main offering.
For example, if you lowered the price of your product in the hopes more people buy, you should see a corresponding uptick in your conversion rate on that page. If not, the price might not be what is deterring people from buying. Although overall goal completion is important, looking at your completion rate ensures an increase in traffic isn’t masking a larger problem in your website.
Finding Your Historical Data in Google Analytics (UA)
As mentioned earlier, Google will allow you to access your historical data for any properties created in Universal Analytics. We included some reference points in case you want to find similar metrics for past activity on your website.
1. Users (UA)
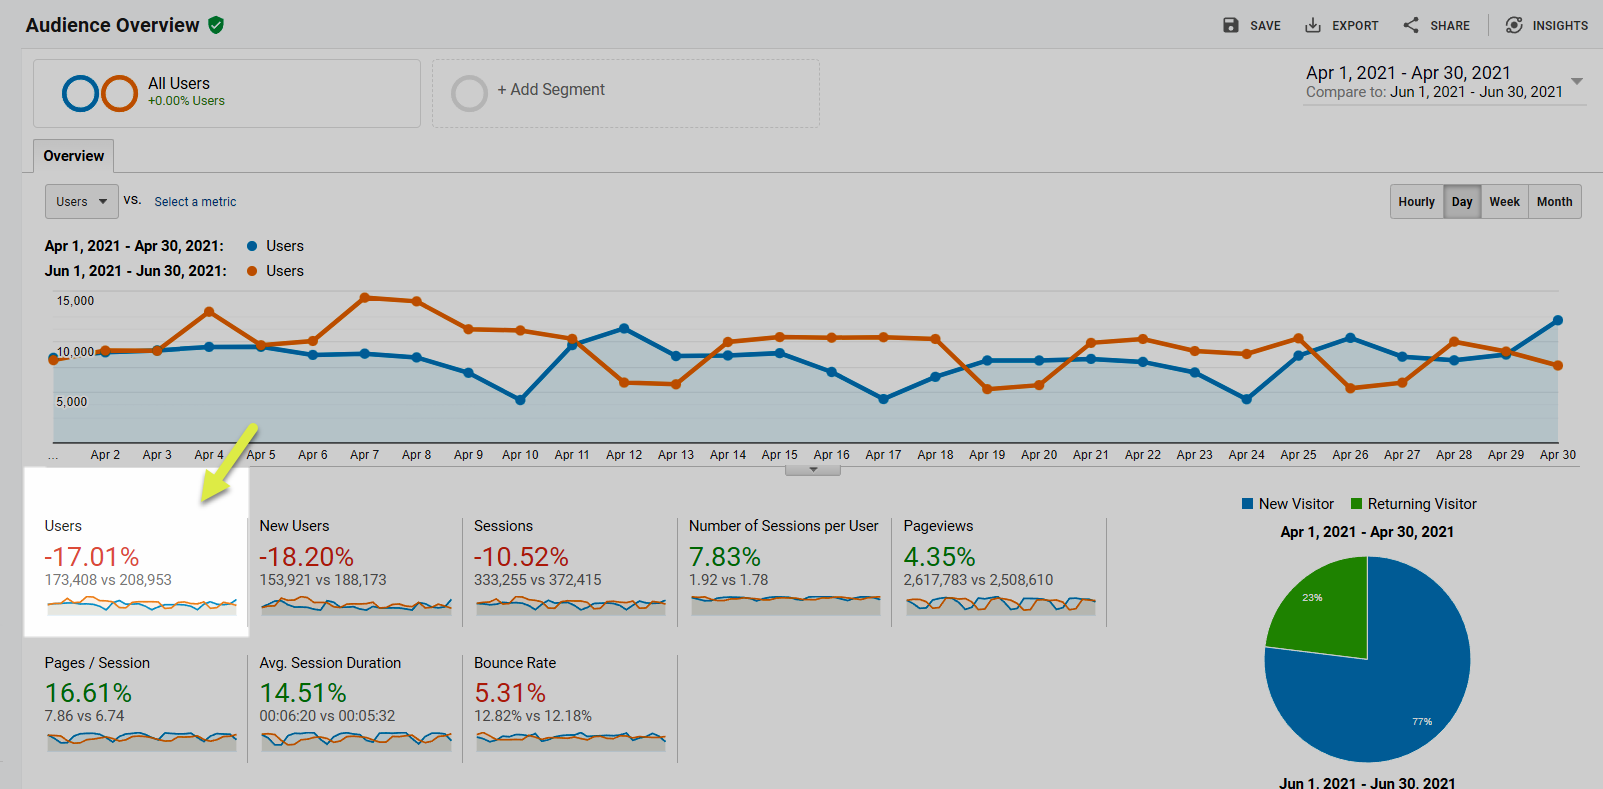
How to find user metrics: Audience > Overview
How to go deeper: Segment by traffic source (Acquisition > Traffic > Channels) to see where your gains or losses are coming from.
2. Landing Page Sessions (UA)
How to find landing page sessions in UA: Behavior > Site Content > Landing Pages
3. Exit Rates (UA)
Exit rate is the percent of people who get to a page and then leave your site when they’re finished there.
How to find exit rates: Behavior > Site Content > Exit Pages
How to go deeper: Use the dimension “Source/Medium” to see how these people landed on your site in the first place. Or use the dimension “landing page” to see where they arrived on your site. Also, narrow your selection of pages to the ones most important to your goal completion process (like checkout or signup pages).
4. Average Session Duration (UA)
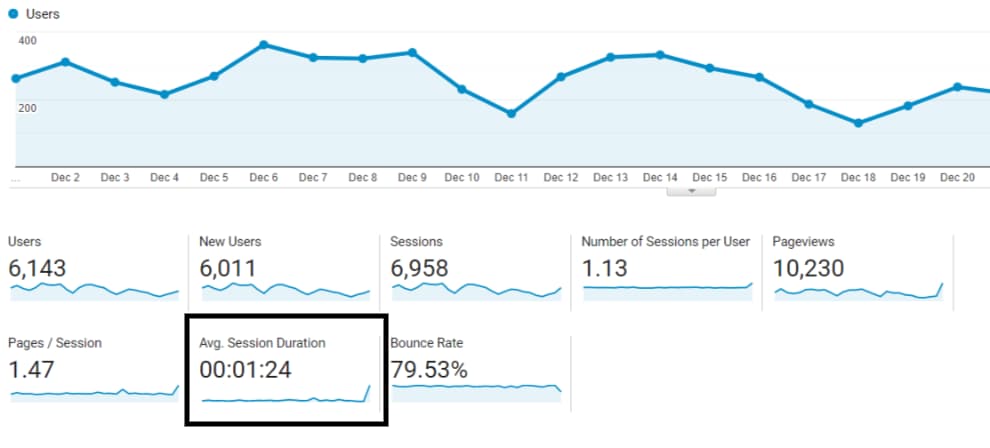
Average session duration measures how long users stay on your site on average. We chose to measure Engagement and Bounce rates in place of this through GA4 metrics.
Why it’s important: It’s a shorthand measure for how engaging your content is. If your average session duration is under one minute, then most people find one thing and leave your site. The more time people spend, the more time you have to sell them on whatever your website is about.
How to find average session duration: Audience > Overview
5. Top Events (UA)
Top events is a list of the most performed actions on your site based on the events you’ve set.
How to find top events: Behavior > Events > Top Events
6. Click-Through Rate (UA)
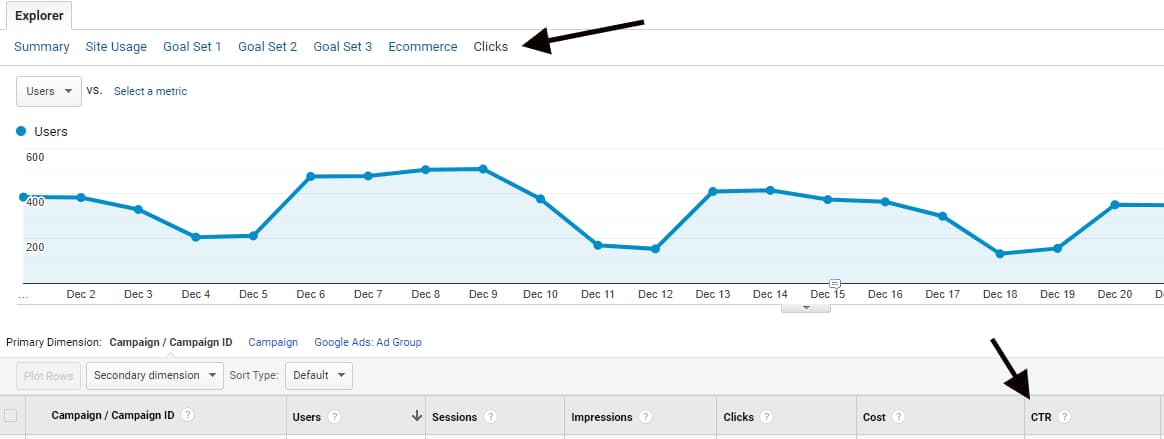
How to find click-through rates: For Google Ad click-through rates: Acquisition > Google Ads > Campaigns > Select “Clicks.”
For click-through rates from Google Search: Acquisition > Search Console > Landing Pages.
7. Revenue by Traffic Source (UA)
Revenue by traffic source looks at how much money each traffic source brings to your site. This is available in your historical data if you previously set up ecommerce on your site or put a dollar value to each of your goals on GA.
How to find revenue by traffic source: Acquisition > All Traffic > Channels
8. Goals (UA)
How to find goal conversions: Conversions > Goals > Overview
Want to Find More With Google Analytics?
Google Analytics packs in so much that it can be confusing, even when you have a guide walking you through the basics. If you want to learn more, check out our beginner’s guide to Google Analytics best practices. Inside, you’ll learn the best tips and tricks beginners can use to become familiar with and get insights from Google Analytics.
