
Whether you want to know how many mobile devices accessed your contact page from Albania or what percentage of your traffic is made up of “travel buffs,” the questions you have about your website and its audience can most likely be answered by Google Analytics—no matter how silly or granular they may be.
In fact, the problem with GA’s data haystack is that most people don’t know where to find the needles of information they are actually looking for. Instead, they get distracted by vanity metrics and try to make decisions based on macro trends that tell them little about the best way to optimize their site.
Google Analytics can be a deeply complicated place and easy to get lost in for people new to this program. However, these best practices can act as a guide for you, helping you bypass much of the meaningless data so that you can quickly and easily navigate to the answers you need.
When using GA becomes less random wandering and more a targeted journey from A to B, you'll save time, focus on data points that matter to you, and get a better understanding of how your website is performing, so you can make the decisions that will put it on track to grow and succeed.
1. Learn What's New With Google Analytics 4
If you have only seen the notification emails and kept thinking "I really need to read up on that," then this is the time. Google's Universal Analytics (UA) was the older version that stopped collecting data in July 2023. Website managers have been making the transition to Google Analytics 4.
The change helps website managers and app creators find more meaningful analytics that reflect the way people are interacting with them online. Measuring app users is a great example.
If you had been using Google Analytics' older version, Universal Analytics, you can transition to Google Analytics 4 (GA4) easily. Use the GA4 Setup Assistant shown on your analytics home page.
Alternatively, open the Admin section of your Google Analytics through the menu option on the left. You will see a button to "Create a New Property." That option helps you set up a new GA4 account from scratch. The Setup Assistant is the better option if you are transitioning from one older UA property. Some, but not all, of the configurations will carry over like goals and audiences.
If you don't want to carry over any details, you can opt out in your Google Analytics settings.
Your best practices remain the same, and we're doing our best to update the language and steps used below. It might be helpful to understand the bigger changes on the platform.
Views are gone. Filters are in.
In the past version, we set up views to see the way specific groups used the site. There was one view for visitors from the U.S., or another view was for all traffic. Now with GA4, you use filters to distinguish between audiences and traffic flows.
You can even combine filters to customize your reports.
For example, one new filter identifies internal traffic (after you define what's considered "internal"). This is useful to ignore on-site visits from your own team.
Measure Events and Conversions
Get familiar with Events. In GA4, you're going to see and hear that term everywhere.
The Hits (and hit types) on Google Analytics have become Events. For example a page view is now recorded as a page_view event. Events are any actions that our users take. Those events are processed and collected, and you can access them through reports.
Google Analytics has automatic events that it collects by default. These are what you'd expect: traditional page metrics like user engagement and in-app purchases. The different events have more details collected as parameters. For example, when someone reaches the bottom of a page on your site, that is an event called "scroll," and its parameter is "engagement_time_msec" that tells you how long they spent actively on the page.
You don't have to do anything to set up these automatically collected events, but there are some recommended events you'll see from GA4 that will need to be configured or added.
An event measures anything from loading a page to clicking a button or even purchasing a product. The events are fully customizable, so you can measure what matters to your business.
If you want your Google Analytics to measure every time a user signs up for your webinar series, you can do that through an event.
One best practice that might help you set up custom events is to use the Google Tag Manager (GTM). It can streamline your installation, and ultimately it keeps your tracking tags in one place. However, it is not a mandatory component for using GA4. You can choose to directly implement Google Analytics without GTM if you prefer a simpler approach.
2. Take Courses or Bookmark Your Favorite Lessons
You might be tempted to set up a Google Analytics account and get started right away. With so many tutorials available on Google Analytics (from Google or from 3rd party specialists), there's no need to use trial and error to get started. For beginners, getting a solid foundation through Google’s own Skillshop courses is a solid way to learn.
However, considering that Google made a major leap to Google Analytics 4 in 2023, every existing GA user is relearning the platform. That's good news for you, because that means there was a surge of updated, fresh material to bring you up to speed. I found guides and eBooks, but sometimes the best examples were basic pages I found by searching "____ in GA4."
Pages from Analytics Help popped up the most. I suggest that when you use Google's resources, try to search for the most granular thing possible. For example, I was initially confused about filters until I found that they had two types (full explanation and clarification coming up). Get specific answers from Google's Analytics Help pages, and you'll find yourself taking small steps but definitely building up your understanding. Progress!
I also found myself learning a lot from Optimize Smart and their easy-to-follow examples on details that Google can often skim past. Some of these lessons in their GA4 tutorial list might seem more advanced than what you need as a beginner, but if they appear in your search results for a particular task, then know that their materials are understandable and accessible for all skill levels.
3. Figure Out Your Website’s Most Important KPIs
Before you begin customizing your GA account, you need to know what data to spend your time tracking. This starts with determining your website’s key performance indicators (KPIs). Google Analytics is the perfect tool for tracking and measuring three main types of KPIs:
- Acquisition KPIs: Metrics concerned with how readers get to your site
- Behavior KPIs: Metrics that tell you how users engage with your website and move along their buyer’s journey
- Outcome KPIs: Metrics that track goals and conversions on your properties
Possible KPIs you could track on your site include:
Behavior
Time-on-page. An important metric that gives you an idea of how much people are engaging with your content.
Engagement and Bounce rate. These metrics are easier to remember when you pair them together. In GA4, an engaged session means that a user has been on the page for at least 10 seconds. (It also counts if they had a conversion event or at least 2 pageviews or screenviews.)
The percentage of all sessions that happen to be engaged sessions = engagement rate.
The bounce rate is the inverse. The percentage of all sessions that aren't engaged sessions count as the bounce rate.
A landing page should have a lower bounce rate than a receipt page, for example.
This is another shift in definition from what we used in UA, but at least now the definitions of engagement and bounce rate are much more intuitive.
Exit page statistics. These pages are the last page users see before leaving your website. High exit rates on a particular page might show it is poorly optimized.
Acquisition
Organic traffic volume. The amount of traffic that comes to your site from unpaid search.
Pay-per-click (PPC) traffic volume. The amount of traffic that comes from paid links on search.
Referral traffic volume. The amount of traffic that comes from links on other websites.
Direct traffic. Traffic that comes from other sources, including when someone types in your URL.
Outcome
Conversions Events. How many times you get a conversion, a completed action that contributes to your primary digital marketing goals, over a period of time. More on this in section 5 below.
Return on ad spend (ROAS). How much money you make in sales/conversions from ads after accounting for the money you spent on the ads. It's a little leap from traditional ROI, and that could help you make the case for a boost to your budget.
Cost-per-click (CPC). The cost of the average click generated from a PPC campaign.
The KPIs you choose to track should always connect back to the ultimate goals of your website. For example, if you are a company that uses social media to sell bespoke kitchen knives on your website, then you would want to track your social media traffic volume and how many conversions you’re getting from social media marketing campaigns month over month.
The objective is to find metrics, like purchases, downloads, or signups, that tell you whether you are moving closer to your organization’s high-level goals. Examine your marketing funnel, determine which KPIs will help you understand how well your current marketing efforts are performing, and then start learning how to track them with GA.
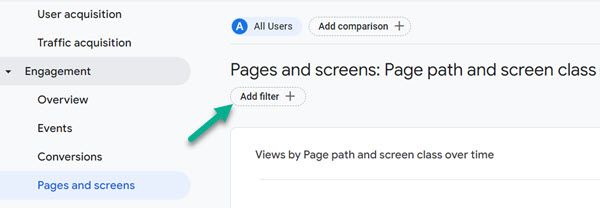
4. Choose Your Analytics Filters
As we mentioned in the Google Analytics 4 section, report filters let you see behavior across different groups of users.
I find this to be a more straightforward way of finding what I'm looking for inside Google Analytics. I just use the left hand side to navigate to the type of report I need, and the filters let me fine-tune the details about how the user interacted with it.
For example, you can filter reports by age groups, by region, or by browser. And since you can combine these report filters, you can see how Firefox users in Canada interact with a specific page on your site.
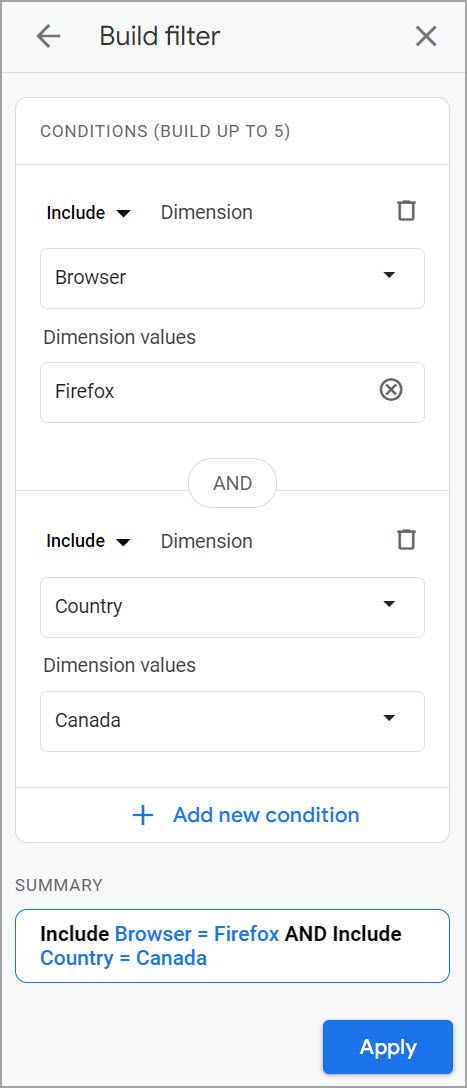
The available dimensions (filter parameters) dig into timing and behavior like "first visit date" and traffic sources. And since you can exclude these dimensions and include others, you can combine these to understand how your more experienced users are using a certain page over time.
As you become more familiar with report filters, remember that the goal is to sort your data in a way that helps you find better insights. Some common ways you could achieve this include:
- A filter that isolates your target market
- A filter that is restricted to first time visitors
- A filter that focuses on a single traffic type (organic, PPC, social, etc.)
Refer back to the KPIs you set earlier. Which report filters you use could help you better understand how well you are doing in regards to your top KPIs. Find ways to isolate them as a combination of dimensions inside your filters, and you’ll have more accurate data in front of you to truly see how your efforts are paying off.
Data Filters vs Report Filters
Google Analytics uses Data Filters and Report Filters. The two are very different. Data filters are applied at the property level, and they are permanent.
Report filters: Let you see your users based on different segments they might fall into--like age, location, and whether or not they've been to your site.
Data filters: Tell Google Analytics what kind of data to collect. If you want to exclude internal traffic from all of your reports, that's a data filter.
At no time should you ever modify or remove your original data filters--unless this is 100% an intentional switch. Once you do, you stop GA from collecting that data. Instead, create a new property before adjusting the data filter.
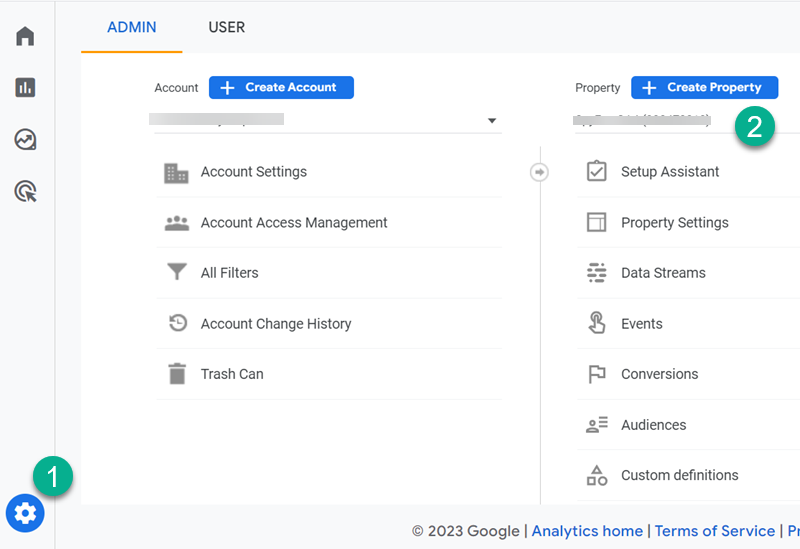
To set up a new property in GA, go to your admin settings (the gear icon on the navigation bar), and then click the blue “+ Create Property” button.
If you want to switch between these properties/data sets, you can click on the drop-down menu on your home page.
Data filters work on a forward view. They don't change historical data, and they can't be changed back. That's why we offer such a strong warning as part of your best practices.
Keeping an unchanged property (with no new data filter) means that you will always have your complete website data set to fall back on and examine.
5. Set Conversion Events (Goals) on Google Analytics
Tracking conversions on your website helps you measure your success and find where some efforts can improve.
The point of analytics overall is to find exactly where to optimize your web pages. In this case, you are optimizing to increase your monthly conversion rate.
On Google Analytics, a conversion event tracks an action taken by a user that you would register as a conversion: a sign-up, a purchase, a download, etc. Those familiar with the past Universal Analytics will remember these as goals.
And as we covered earlier, any action in GA4 is an event. The difference here is that you categorize an existing event (of your choice) as a conversion when it's an action that matches your ultimate business goals. For example, a wedding venue can set an online booking as a conversion event, but they might also set a conversion event when someone signs up online to tour the facility.
Ultimately, you can track all of these conversions in Google Analytics using a Conversion Report.
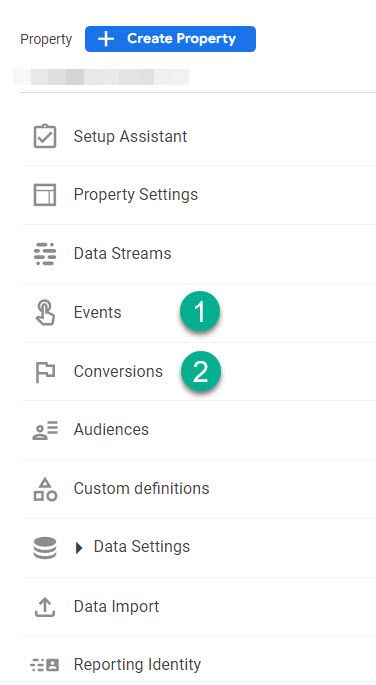
To create a conversion event, use your Admin gear icon in Google Analytics, and then look for the options under your property.
- First click Events to set up an event that you'd like to track.
- Then click Conversions in that same section. This lets you choose that event from your list to mark it as a conversion_event.
By setting up conversion events in GA, you can learn how many times you reached your goals with your audience in a month, your completion rate, and how much your completed conversions are worth in an estimated dollar value.
When it comes to best practices, we recommend a few things with conversion events:
- Import your conversion data into Google Ads. It will recognize the conversion events you created and take those into account. This is helpful with smart bidding and optimizing your PPC campaigns.
- Create multiple conversion events. You aren't limited to just one. By creating multiple ones, you can track micro-conversions to help you optimize the customer's path. If something goes askew, you can pinpoint that part of the funnel faster and with more confidence.
- Set a value for every conversion. Think beyond the price of your product. If you are a SaaS company, a one-time sign up will have an average lifetime value. If you charge $20 a month, and the average customer stays 7 months, set the purchase conversion value to be $140. A newsletter signup can cost nothing, but if you calculate the percentage of newsletter signups that eventually turn to sales, then you can assign it a value.
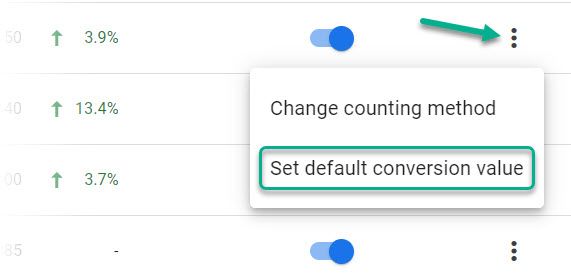
Open the list of Conversions in your Admin>Property settings and use the 3 dots to get the conversion value option. Click it to set your amount.
Values help you estimate how much these conversions are worth to your business in dollars. Although it is optional, adding a value is a best practice that will help you take a different perspective of actions on your website.
- Track bad news. Remember that the purpose of tracking these events is to stay on top of information that’s important to your business. The information doesn’t need to be positive to be beneficial. For example, you could set an event that tracks people who reach your cancellation page. With this event, you could easily see whether your cancellation numbers are up this month, so you can make appropriate changes if you start to see an increased number.
6. Be Wary of GA’s Data Misconceptions
For all the wonderful things you can find on GA, you still need to be careful of some of GA's more misleading data. Consider these as Analytics’ limitations. As long as you know they exist, then you shouldn’t run the risk of basing your decisions on misleading or inaccurate data.
The first problem that plagues GA’s data is “dark traffic.” Dark traffic is the traffic that Google can’t determine the source of. When you look at your traffic by sources, you should see a healthy percentage of traffic from a blend of sources including organic search, referrals, social, and direct traffic.
Dark traffic hides in the direct traffic source; for instance, in this above screenshot, we can see that more than 64% of all traffic for this site comes from “direct” traffic sources.
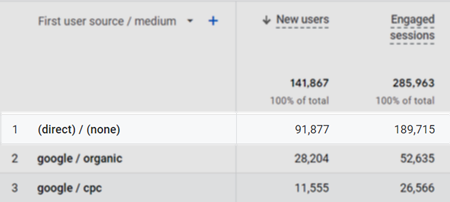
But what does this mean? Generally, when we think of direct traffic, we think of people knowing your website, typing your URL in, and directly visiting. However, it's rare for a website to get a full 64% of their traffic solely from people typing in the URL.
Usually, you can expect organic search to make up the largest chunk of your actual traffic, with PPC, social, referral, and direct making up the rest. The inflation of direct traffic on GA comes from dark traffic, and, unfortunately, there’s little you can do about it.
Your best practice here to discover where that traffic is coming from is to track your efforts. Watch for spikes in direct traffic and then try to correlate it to a new link, a new promotion, or anything that could possibly drive this traffic.
Beyond that, it’s best to remember to take your direct traffic numbers with a grain of salt and not to base too many decisions on those statistics.
Another big data inaccuracy on (Universal Analytics version of) Google Analytics has to do with the average-time-on-page metric. Average-time-on-page tells you how long the average user spends on your pages. If you have a page with an above-average time-on-page, then you should analyze what it’s doing right so you can replicate it in future content.
However, although this data is useful as a comparison, it is less than accurate as a firm number. This inaccuracy is due to how Google tracks time-on-page.
Note: this point applies only to the UA version of Google Analytics. Although it stopped collecting new data for websites, the historical information is still accessible. Any site managers looking at this older data should keep this metric's quirks in mind.
When a person moved between pages on your site, Google would track how long they spent on the first page they visit by comparing timestamps of when they arrived on page 1 and page 2. However, when there is no engagement with the final page visited, Google would not track how long the user stayed there. So, the time-on-page is calculated as zero for the final page.

For example, in the image above, after the user visits page 3, they leave your site, but since there was no interaction, Google records the time-on-page as 0 seconds, even if they had spent a minute reading through that page before they left. This calculation method can drastically impact the average time, especially for pages on your site that are often exit pages.
Again, there is little you can do about this other than keeping it in mind when considering the time-on-page metric. As you become more familiar with Google Analytics, you’ll get to know its quirks, too. The important takeaway here is that you should always think critically about the data GA shows you.
Use Google Analytics Best Practices to Find What Really Matters
Sometimes Analytics can feel like an insurmountable haystack with not nearly enough needles to be worth the effort. Still, by following these best practices, we promise the task will become more manageable with a bit of time. As long as you keep your goals and KPIs in mind and work to focus solely on the data that will help you reach those goals, you’ll find GA to be one of your favorite programs for optimizing your website properties.
As helpful as Google Analytics can be, data analysis for your website does not end there. If you want to learn more about your site’s SEO and place on the Google search engine, take a look at our guide to using Google Search Console, so you can optimize and boost your organic traffic sources.1
